Market Intelligence for Brands and Manufacturers

Data is one of the most valuable assets for companies. In today’s digital age, the success of strategic decisions depends largely on the scope and quality of data collection and information analysis. The enhanced features of our Market Intelligence Services enrich the analytics landscape and serve manufacturers in e-commerce.
To provide manufacturers and retailers with the best possible support for their current challenges in online retailing, our software solution is continually being further developed in close cooperation with stakeholders of our customers. The milestones currently being implemented in the
- Retail Monitoring (trader monitoring)
- Review Monitoring (customer rating analysis)
- especially manufacturers get their full value. In this article we would like to give you an insight into the extended functionalities of the Market Intelligence software.
Market Intelligence for manufacturers offers monitoring of retailers
Retailers have different requirements for Market Intelligence systems than manufacturers. For retailers, the focus is on competitive comparison. Manufacturers, however, also require market monitoring for products and their sellers’ behavior.
Software-supported market monitoring with priceintelligence’s Market Intelligence offers a visualization of price positioning per seller via a manufacturer’s dashboard. This enables you to find out how many products of the overall assortment a specific vendor sells cheaper, more expensive or at the RRP (MSRP). In the dashboard, the appropriate threshold values can be adjusted as required and individually.
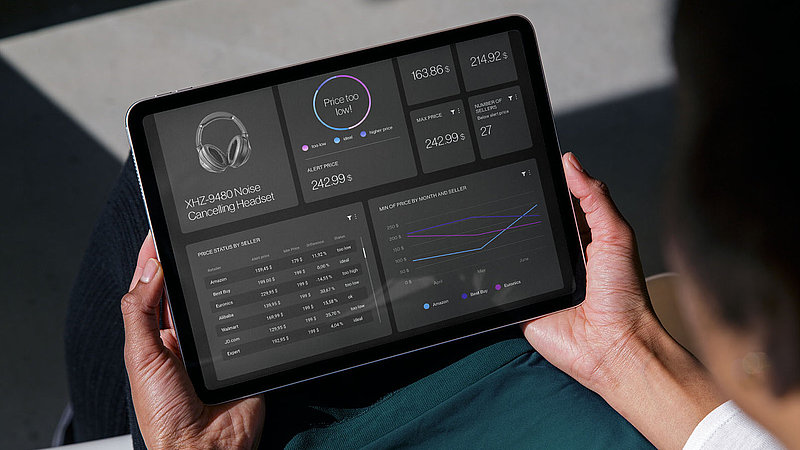
What does this Market Intelligence manufacturer dashboard illustrate?
- The pie chart shows how many retailers list the 229 products imported by the user on online platforms. In this example, a total of 350 distributors are listed according to an individually defined threshold.
- The bar chart shows a total overview of the price positioning per seller i.e. the user sees retailers who sell his products.
- Behind each seller there is a specific price index. For example, the value 0.85 means that the seller sells products on average 15% cheaper.
- The threshold values refer to the pie chart as well as to the bars “expensive”, “same” and “cheaper”. This is where you can determine from what percentage deviation from the RRP (MSRP), a product is classified as too expensive, too cheap, or optimal.
- Exemplary threshold: cheaper: 0,9 (10%) and expensive 1,1 (10%)
- Manufacturer product price=100€, retailer product price=88€ → price range (90-110€=optimal) → price status for this product at this retailer: „cheaper“
- My (manufacturer)product price=100€, dealer product price=95€ → price status= „optimal“
- A mouseover on each bar shows the number of products assigned to this price status.
- By using the filters, specific brands, categories, etc. can be displayed. The price positioning adjusts according to the filter.
Differential evaluation via achieved threshold values in Market Intelligence
For producers it can be relevant to know how threshold values for their products are allocated in the analysis. A solution has been developed for this purpose as well. Market Intelligence offers a calculation that shows how many products are sold by retailers at certain thresholds.
From this, it can be concluded whether and how many sellers adhere to the RRP (MSRP) and how many products of the respective retailers are offered below or above the recommended retail price.
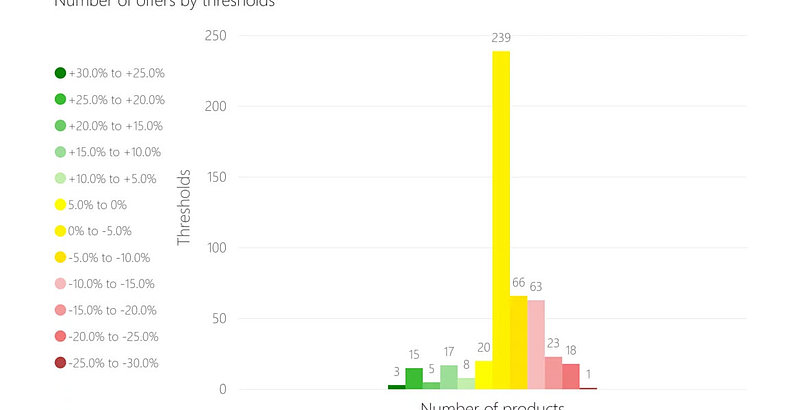
By clicking on the bars in the chart, the manufacturer dashboard can show which sellers are hiding behind which threshold and how many products are part of that threshold.
Adaptations during operation
Our software solution is constantly being optimized and revised. Some adjustments are already noted in the roadmap. Therefore, it is possible that you will already find a different color scheme or an improved display of threshold values during a demo session.
Market Intelligence for products includes range analyses
Through consistent monitoring, processes and measures can be quickly adapted and optimized in line with the corporate strategy. Nowadays, however, marketplaces, online stores and online sellers are springing up like mushrooms. It is difficult to keep an eye on all details of what is happening on the market.
For manufacturers, it is important to know which retailer is operating on the market with which product range. The manufacturer dashboard offers an analysis of sellers including an assortment comparison of the offered products.
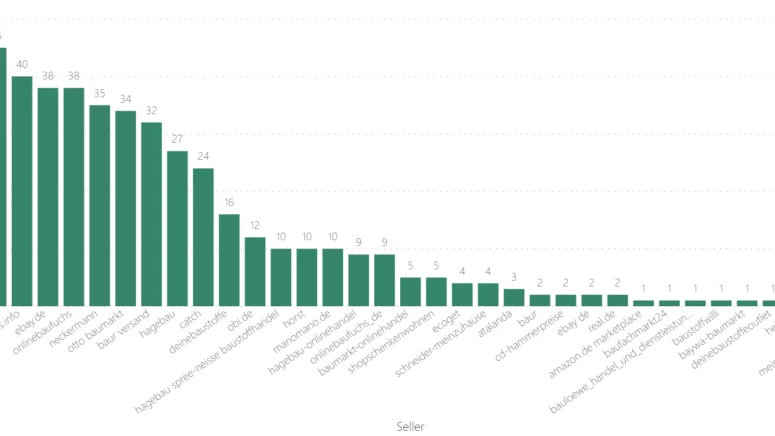
This analysis offers a manufacturer, for example, the possibility to pay special attention to those sellers who have a high coverage of their assortment. In our specific example, our customer has imported an assortment of 60 products into our Market Intelligence software solution. Now he can see that 49 of these products are sold by the retailer “Bauhaus”; 45 products by “Otto”, etc.
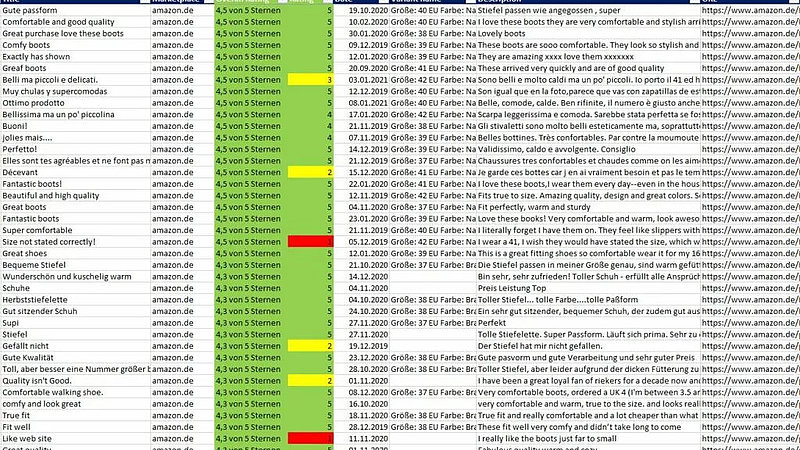
Market Intelligence for products enables rating analyses
Manufacturers have a need for a wide range of analyses and evaluations. A very important field are also customer reviews for products. Especially in the digital age, where reading reviews has become a standard part of customer journey decision-making, it is important that manufacturers act professionally at all touch points within e-commerce.
The review analysis of our Market Intelligence software solution provides all relevant information on reviews submitted on specific platforms, such as Zalando or Amazon. This information includes:
- Information about the product (ID, name, size, URL, …).
- Overall rating
- Number of stars of each rating
- Date of the submitted rating
- Rating text
- etc.
Detailed information from the data collection, such as textual ratings, can be used to filter out frequently mentioned catchwords. If, for example, the word “too small” appears particularly often, it can be pointed out in the product description that the product might be too small and that it is therefore recommended to choose a size larger. This minimizes returns and increases customer satisfaction.
Get an overview of our report variety, which results from the rating analysis. Many helpful information can be found here, as the following graphic shows as an example.
Market Intelligence for online marketplaces
Manufacturers and brands need transparency, overview, and structured information to be able to identify and assess trends at an early stage before initial triggers have a noticeable impact on brand perception. priceintelligence currently covers relevant markets in more than 20 countries worldwide. This means for you: real transparency across all marketplaces that are important in your business.
In our current whitepaper „Brand and marketplace: How to address customers intelligently“, we explain in detail how you can monitor and protect your brand on online marketplaces. After all, it is essential to act and optimally perform with sustainable strategies to improve brand perception and strengthen brand image.

We have already impressed you? Request a customized demo. Submit your request and we will contact you to schedule an appointment for a demo. Learn how our platform can help grow your business.